
When it comes to a life expectancy report (LE report), you do want to know something about how the sausage is made. Even if you use LE reports on a daily basis, it’s important to understand what is in a life expectancy report and have a clear understanding of how each LE company determines life expectancy, so you can make the most informed decision when you’re managing a life settlement transaction. Not all LE reports produced in the life settlement industry are created equal, and the differences between reports can often mean overpaying for a life insurance policy or purchasing it at the right price. As you would expect, the differences lie in the way different life expectancy underwriters approach the problem of assessing longevity risk. This knowledge is crucial for effective retirement planning, ensuring that financial strategies are built on accurate and reliable data.
What Goes into Creating a Mortality Table?
Let’s start by examining what information is included in a life expectancy report. At ISC, our LE reports contain both a table and a chart containing relevant data points. Together these two elements can be used to describe the mortality curve applicable to the subject insured within the population of which they are a member by virtue of their age, sex, and smoking status.
ISC reports also include information about the medical impairments, lifestyle factors, and functional status issues that contribute directly to the insured’s expected longevity. These conditions are evaluated to produce a mortality rating, which is then applied to ISC’s proprietary mortality tables to calculate the LE applicable to the subject insured. ISC’s actuaries compile and analyze ISC data to construct the mortality tables we use to calculate LEs for our reports.
What is in a mortality table? It depends. Here is why it’s important to understand the difference between ISC’s approach and using a generic mortality table that you’d find online. The CDC generates generic mortality tables (also called life tables or actuarial tables) based on general population (e.g. census) data. These tables list the mortality rates by year based on the age, gender and race for the entire U.S. population. Thus, they are broad and non-specific, and use the law of large numbers to provide the probability of mortality (i.e., the likelihood of dying) for the US population based solely on historical death rates for each age, gender and race category.
As you might expect, the CDC tables, as an example of general population-based mortality tables, are too broad, do not use any form of underwriting analysis, and therefore are not specific enough to assess individual longevity risk (i.e., micro-longevity). These tables simply portray the expected mortality rates for the general population based on a few simple factors — age, gender, and race. Thus, they are not at all useful for more precise applications like life settlements or financial planning. They don’t take into account the myriad other unique factors that also affect the life expectancy of an individual, such as past and present medical conditions, lifestyle factors like exercise, drinking and drug use, and functional status, to name a few. Additionally, since race cannot be included in the underwriting assessments used in the life insurance industry, most general mortality tables only use gender and age as differentiators.
In short, generic tables do not tell the entire story, particularly for an individual insured, and in our data-driven, highly customizable world they are virtually useless for life settlement purposes. We do not recommend using such tables to determine an LE for your clients.
At ISC, we go beyond the generic data by using our proprietary underwriting process to dig into the factors that impact mortality for each individual. Our actuaries construct mortality tables based on their analysis of our proprietary data, gathered over time and based on our unique population of older-aged insured lives. Our underwriters determine the appropriate mortality rating for each insured and apply it to our tables to produce output similar to that shown below:
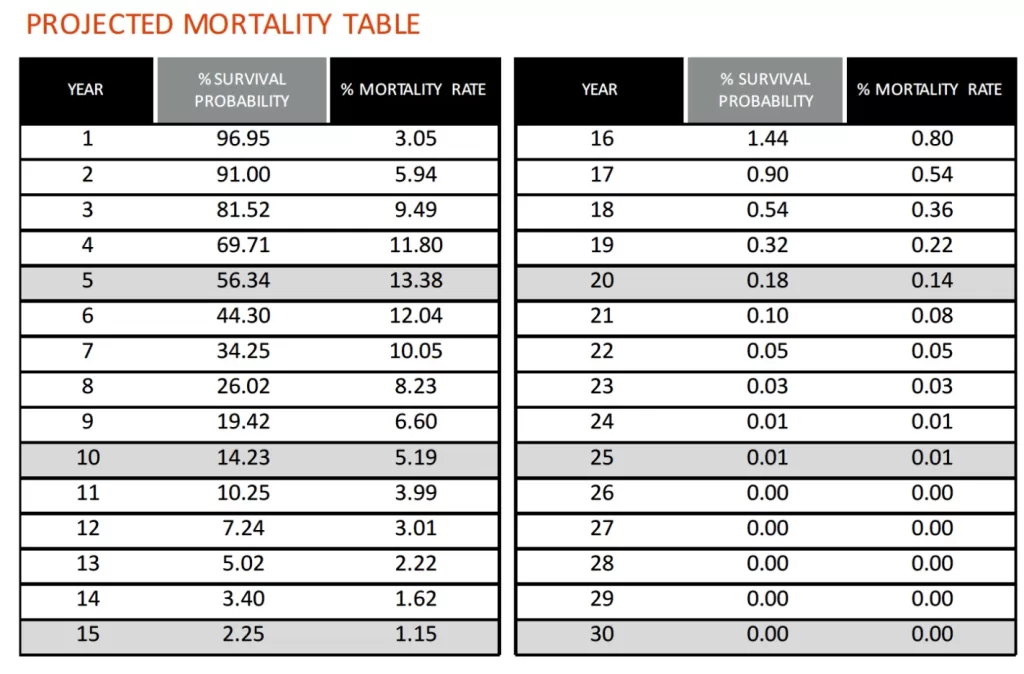
For example, using this table, the underwritten insured has a 81.52% chance of surviving to Year 3. Conversely, within the population of which the insured is a member (i.e., a group of 1,000 “like-kind” individuals having the same age, sex, and smoking status), the insured has a 9.49% chance of dying in Year 3 (assuming they survive to the start of Year 3).
Why Do Mortality Charts Differ from Company to Company?
Now, let’s look at the chart we include in our LE reports, the “Percentage Probability of Death by Year.” The mortality curve for a sample insured is portrayed by the bar chart below. It describes something that is slightly different from the projected mortality table. This chart plots the percent probability of death for a population of “like-kind” individuals (i.e., again, a group of people like the subject insured) in the future, year-by-year. For someone close to 90 years old, the curve might look something like this:
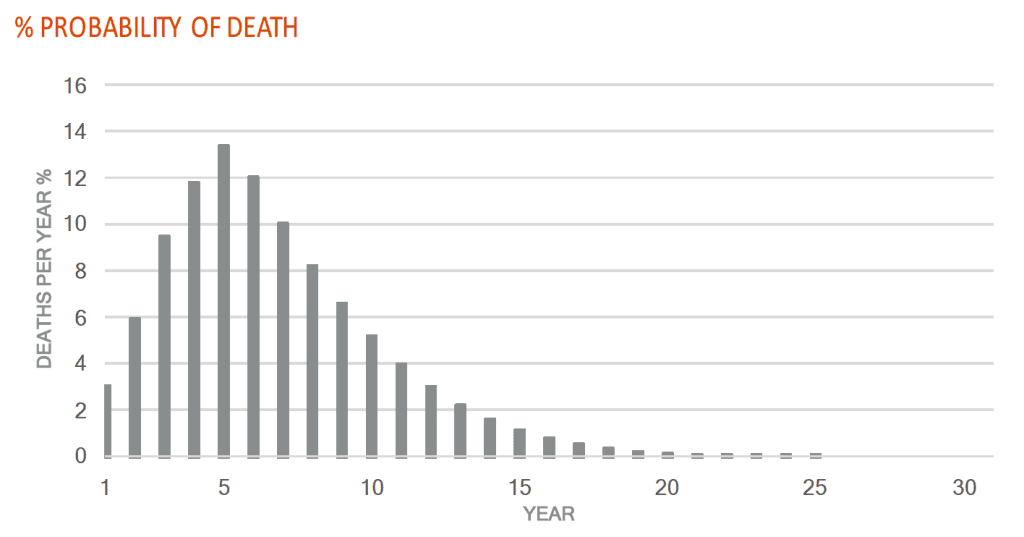
As time passes and the members of the sample population die, the percentage of the population that dies decreases on a percentage basis (because there are fewer of them alive at the beginning of each year). Since we generate this chart based on our proprietary tables using inputs generated through our underwriting process, each such chart is a customized representation of the micro-longevity risk associated with one particular person. You’ll find that every LE company weighs impairments differently, thus mortality curves like this will vary from company to company.
Why Financial Planners Should Prioritize Human Elements in Life Expectancy Reports
How life expectancy reports are created matters. With so much data at our fingertips, we can produce an extremely useful LE assessment. At ISC, we incorporate health care, lifestyle, and functional status information in our LE assessments. By blending some of the more qualitative information, such as drug use or incidence of heart disease, with the quantitative (e.g., age and gender), we are able to produce a more thoughtful and individualized LE report.
Our underwriters have access to a large pool of information about older age, insured individuals whose mortality risk factors and causes of and ages at death were meticulously measured and documented. We comb through medical records, lab results, diagnostic testing results, health care provider and facility notes to inform our assessments and develop our reports. This approach enables our underwriters to understand each unique insured relative to both a standard insured in the same population group and their own personal medical history.
Though the most easily observable factors for LE are demographic, like age and gender, we use these two data points only as a starting point, before evaluating all the other available information to get the most accurate and complete prediction of longevity risk possible. We examine each insured’s unique medical history including any significant impairments, lifestyle factors like exercise, social issues like interpersonal engagement, lifestyle behaviors like smoking and alcohol use, and functional status like their ability to walk or manage their own finances.
Over the past two decades, we’ve issued over 60,000 assessments pertaining to over 40,000 individuals in the life settlement industry. Our experienced team of underwriters evaluates each insured individually to uncover those factors that influence their unique mortality rating. Not only do we deliver thorough, useful assessments, but we’re equipped to do so at scale.
Now that you know what’s in our reports, don’t reach for a generic mortality table the next time you’re trying to determine an LE. Instead, you can harness the information that helps you make the best decision by contacting ISC.


